Here is how Microsoft’s business breaks down. This data is all from Microsoft’s Annual Report, June 30, 2006.
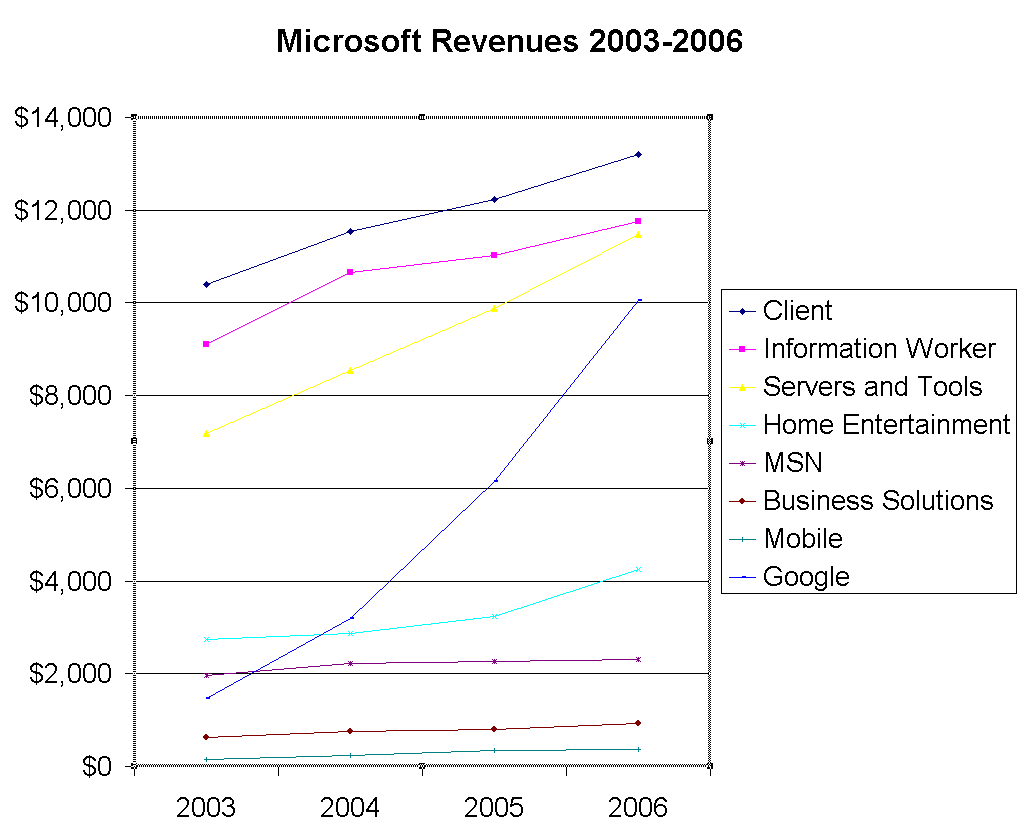
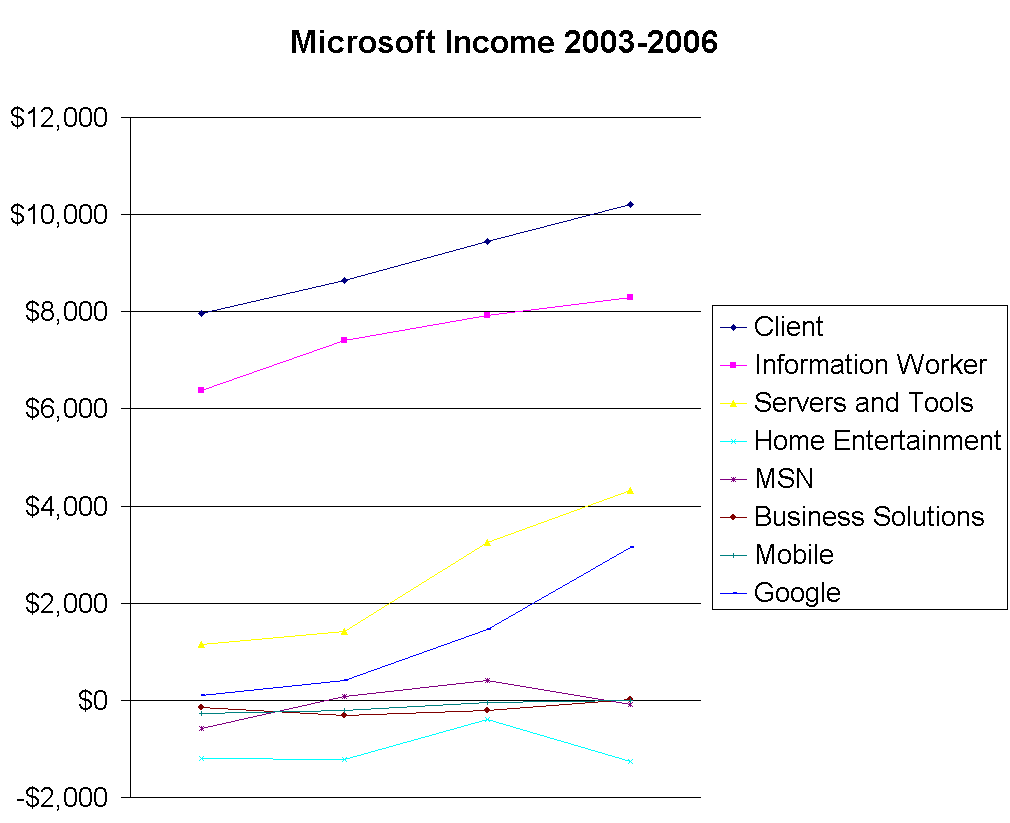
From 2003-2006, Microsoft has reported revenues in 7 business units. Prior to that they reported 4 business units, but I’m not going that far back. I’ve also included data from Google’s annual reports 2003-2006 just to put things into perspective.
Click the charts for full details.
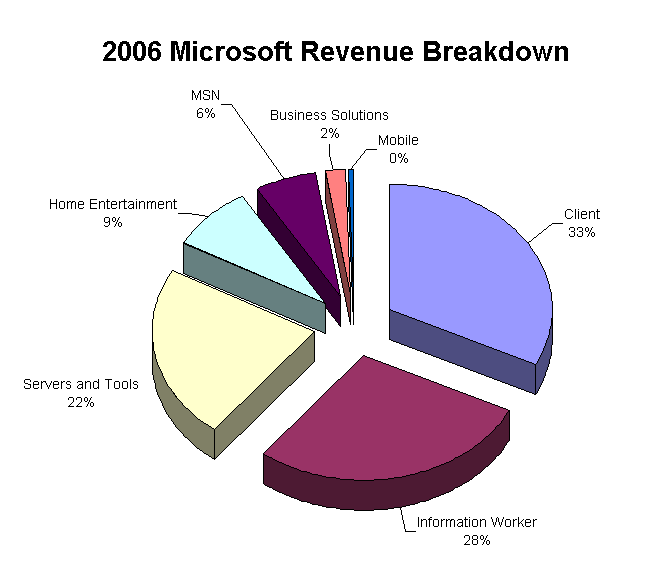 Microsoft’s businesses are:
- Client (Windows)
- Information Worker (Office)
- Server & Tools (Windows Server,
Exchange, SQL Server, etc) - Home Entertainment (XBox)
- MSN
- Business Solutions (CRM, SBA)
- Mobile (Windows Mobile)
Notice that 3 of Microsoft’s business units are each significantly larger than Google as a whole, both in terms of revenue and income. (I estimated Google’s 2006 numbers, since they are not reported yet).
Pingback:Mike’s Lookout » Blog Archive » /. slashdotted
Really helpful !!! i was searching for this