If you’ve shopped for houses in the South Bay, and area schools have been an important factor, then you’ve probably noticed an interesting trend. Areas with good schools have lots of Asians (Cupertino). Areas with bad schools have lots of Hispanics (San Jose). And, even within a single city, you’ll find one side of the city with poor schools and a high concentration of Hispanics, while the other side of the city will have top-rated schools and few Hispanics (Sunnyvale).
Let’s look at the data.
I used API scores and enrollment figures from the CA Department of Education for my data. I didn’t use all schools – I just used some schools where I was interested in – Cupertino, Mountain View, Sunnyvale, Campbell, and San Jose. There are 85 schools in my data, and the exact details can be found in this spreadsheet.
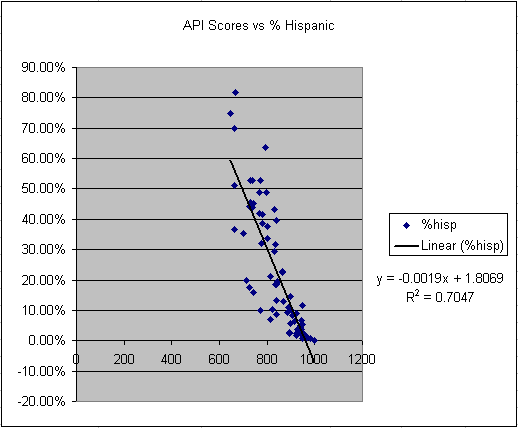
If we look at the API score trend for Hispanics (figure 1). The line shows that as the % of Hispanic students goes down, the API scores generally go up. The linear trend line for this data has a R-squared value of .7047. I’m an amateur statistician, but I do know that R-squared represents the correlation coefficient; a linear line, for example, should have a R-squared value of 1. So plot does seem to demonstrate a correlation.
Keep in mind what statisticians know very well – a proof of correlation is absolutely not a proof of causation.
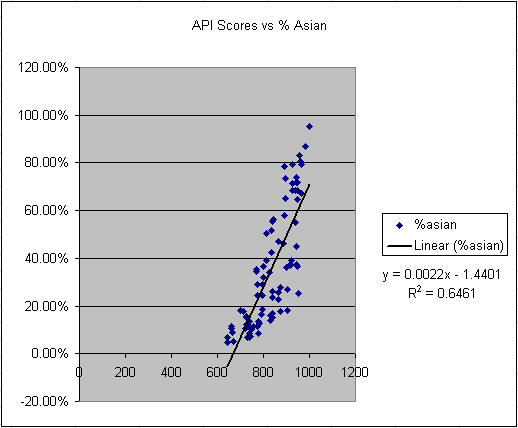
So perhaps the API score trends are not related too poorly performing Hispanics, but rather because of the percentage of higher performing Asian students. The second graph shows the effect of Asians as a percentage for a school’s API score. Here, we see a mirror image of the Hispanic line, where a larger Asian population does seem to indicate a higher API score. The R-squared value is .6461, so there is slightly less correlation of Asians to API score than there is for Hispanics to API score.
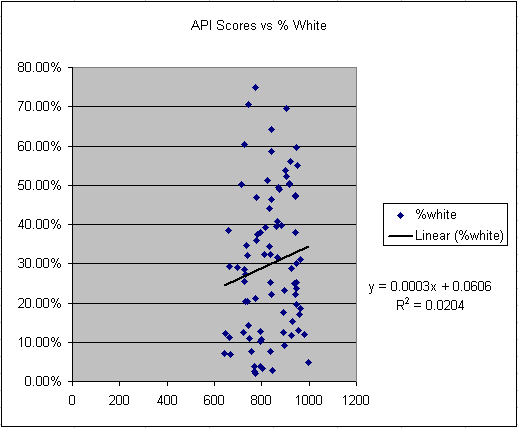
Lastly, we must consider the possible correlation of Whites to API scores, and here we see a very messy plot (Figure 3). The R-squared value for Whites is 0.0204. This is a very low value and shows that for this set of data, there is basically no correlation between the % of white students and API score. Interesting!
Draw your own conclusions. I’m certain that better mathematicians than me can make Swiss cheese of my analysis.